When a flood, storm or earthquake hits, the first question responders ask is the hardest to answer quickly: what changed, and where? Crews cannot be everywhere, and the worst-hit areas are often the ones you cannot reach. Repeat satellite and aerial imagery, differenced automatically, turns that question into a map within hours.
Before and after, on the same grid
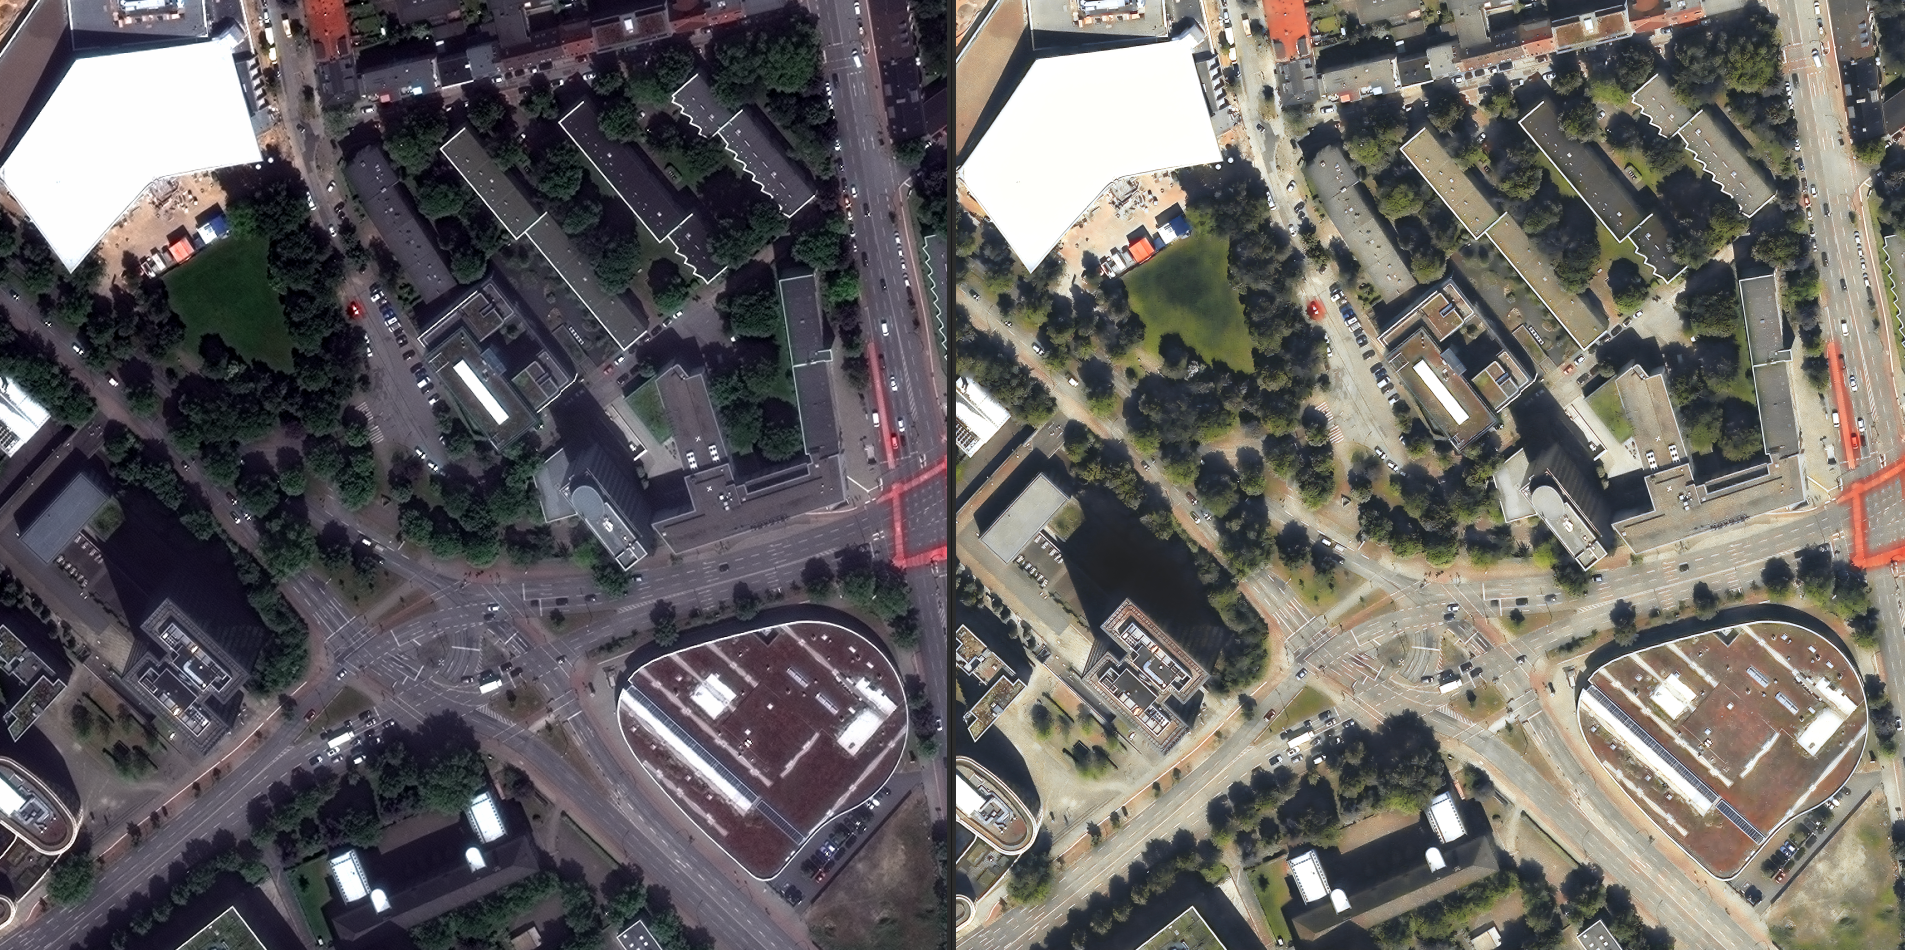
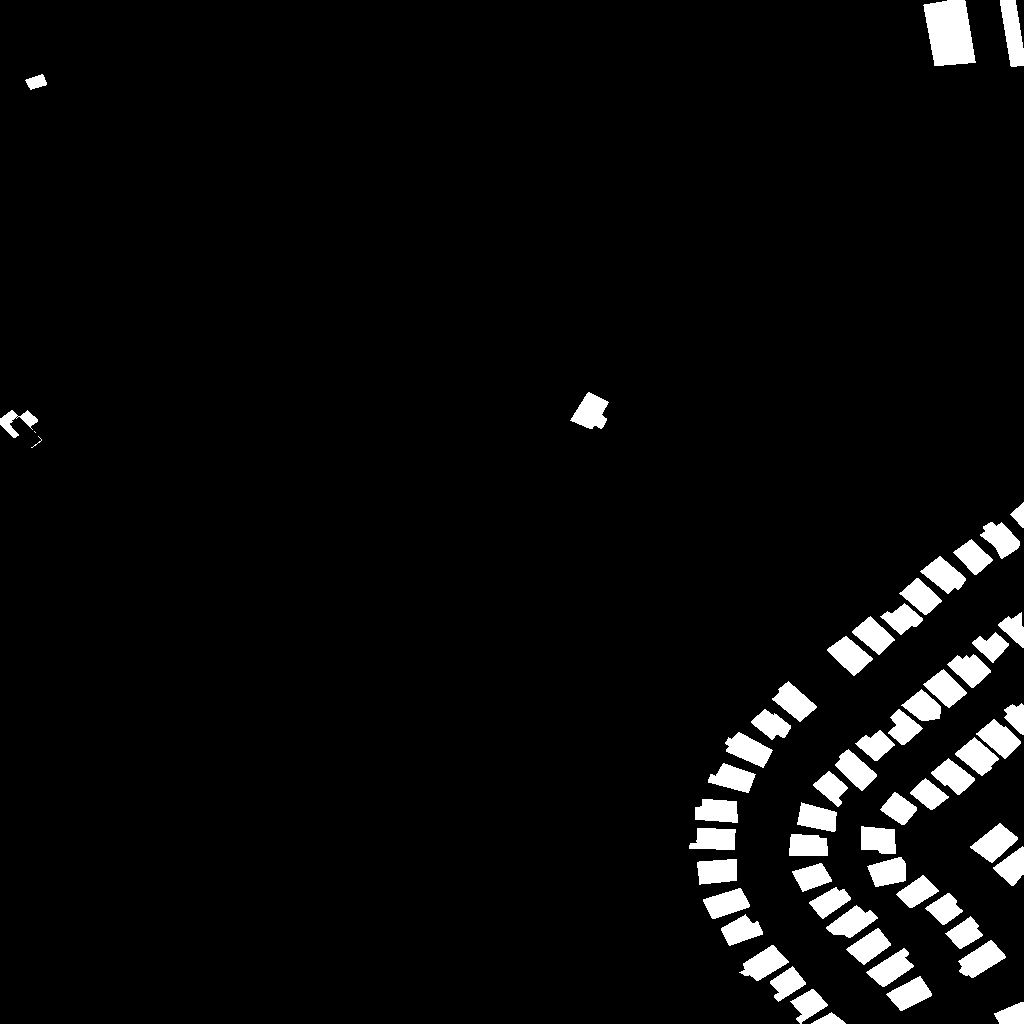
We co-register imagery from before and after an event onto the same coordinate frame, then run change detection to highlight what moved, collapsed, flooded or disappeared. Drag the slider below to see how stark the difference can be:
 BeforeAfter
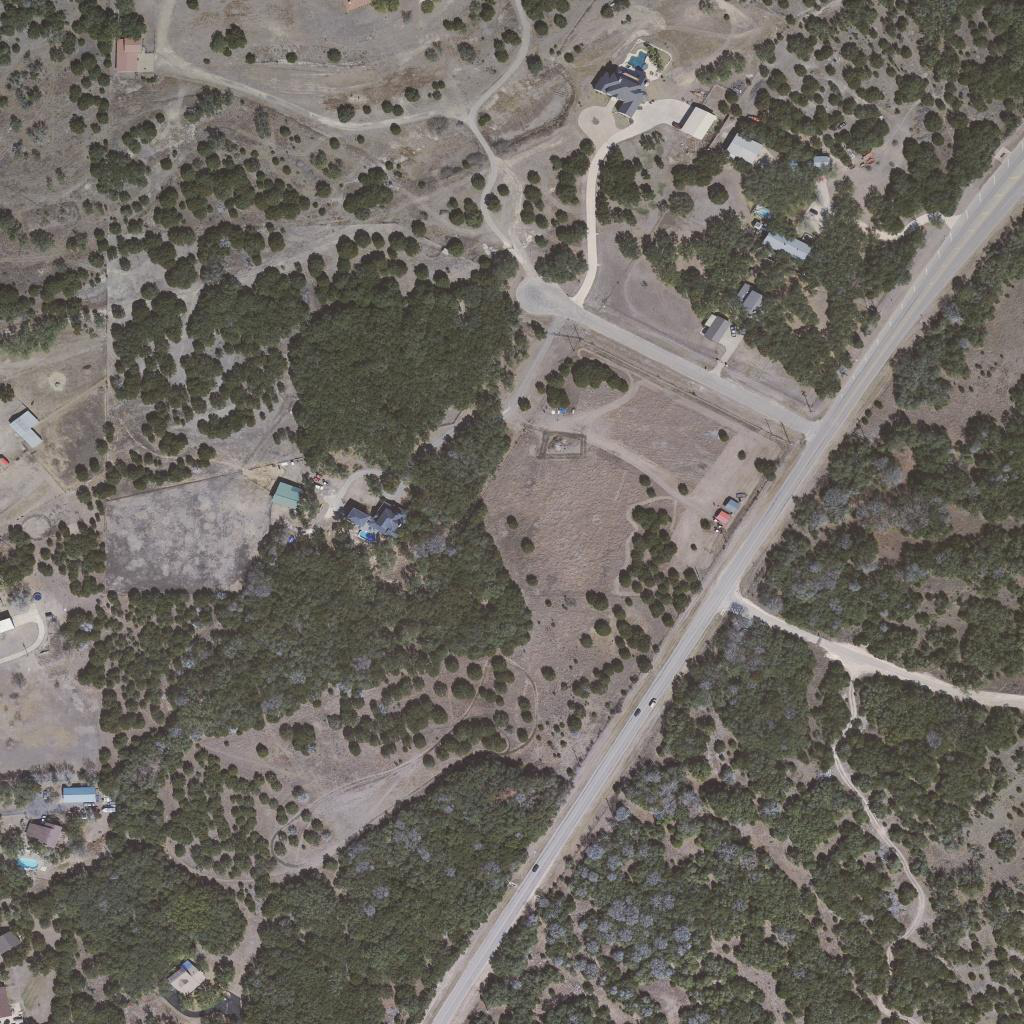
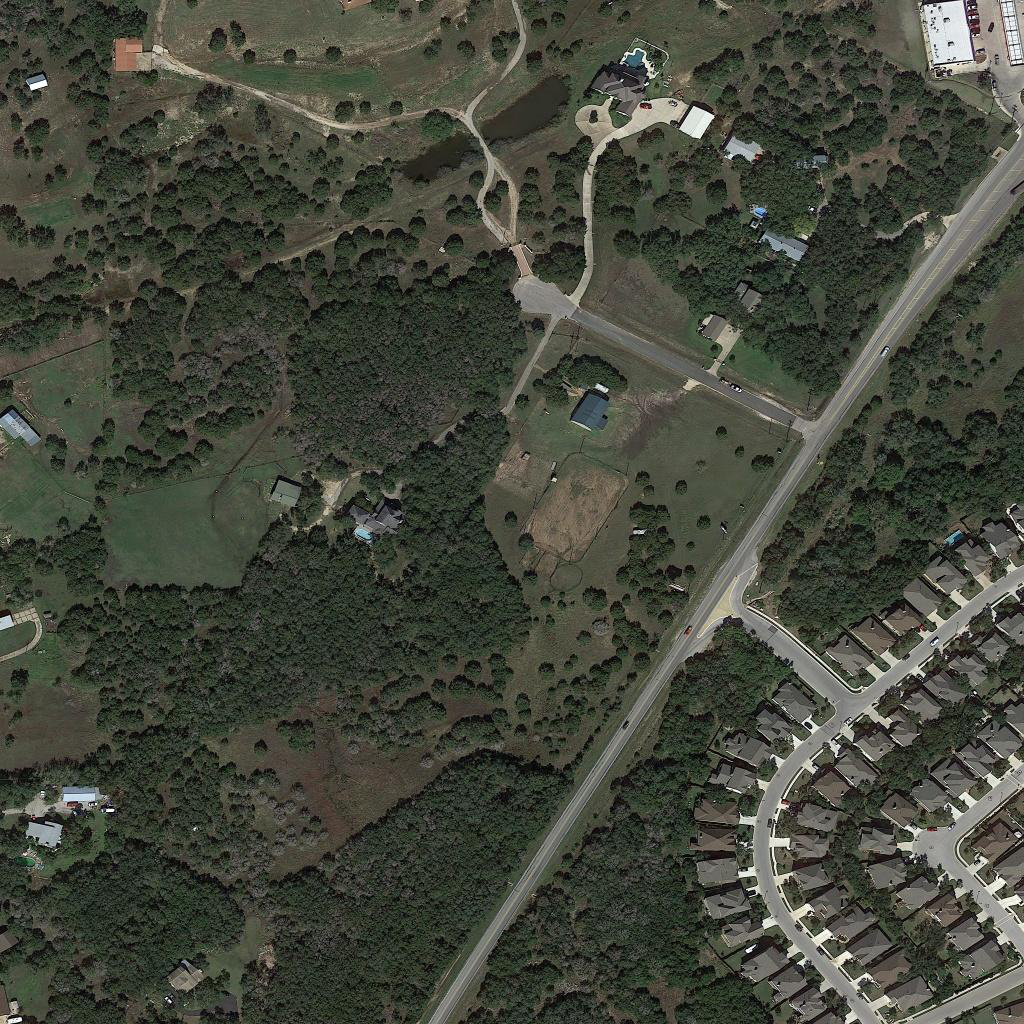
From pixels to priorities
The change mask becomes an actionable layer: damaged-building counts per district, flooded road segments to close, blocked access routes. Delivered into a WebGIS, it lets a coordination centre triage response and direct crews to where they are needed most.
- Fast — first products in hours, not days.
- Wide — whole regions at once, including unreachable ground.
- Objective — a documented, georeferenced record for recovery and claims.
Building resilience or response capability? We can help you stand it up.