When rain falls on a forest it soaks in. When it falls on asphalt it runs off — fast — and that runoff is what overwhelms drains, floods streets and carries pollutants into rivers. To plan for it, cities first need to know exactly how much of their surface is sealed. That is an Earth Observation problem, and a solvable one.
What “impervious” means on a map
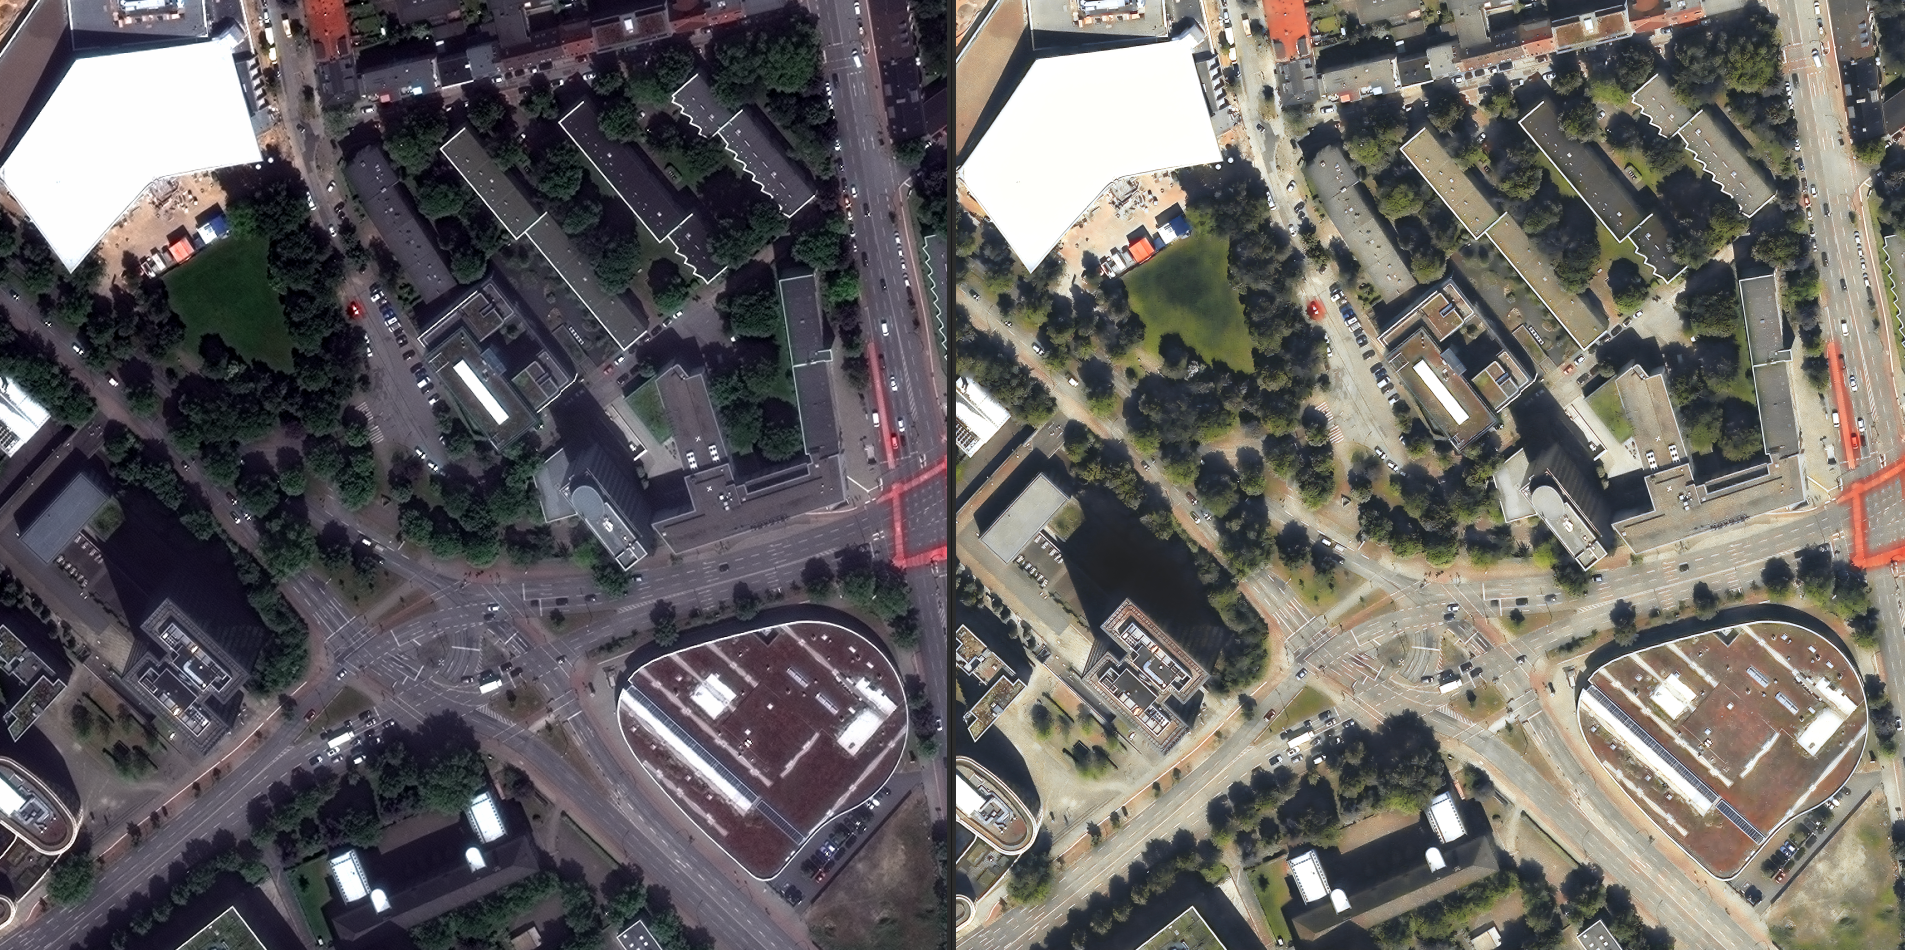
We classify every square metre of an area into surface types — roofs, roads, pavements, car parks, bare soil, grass, tree canopy, water — then group them into pervious and impervious. The result is a wall-to-wall map of sealed surface, down to individual driveways.

What planners do with it
- Stormwater fees. Bill fairly by measured sealed area per parcel, not rough estimates.
- Flood risk. Feed runoff coefficients straight into hydrological models.
- Heat & greening. Find the most sealed, least green blocks and target de-sealing there.
- Change tracking. Re-run yearly to watch sealing creep across the city.
Because the classification is georeferenced and documented, the numbers stand up to scrutiny — important when they drive fees or policy. Pair it with our change-detection workflow to monitor sealing over time.